- 您现在的位置:买卖IC网 > Sheet目录504 > RRH100P03TB1 (Rohm Semiconductor)MOSFET P-CH 30V 10A SOP8
RRH100P03
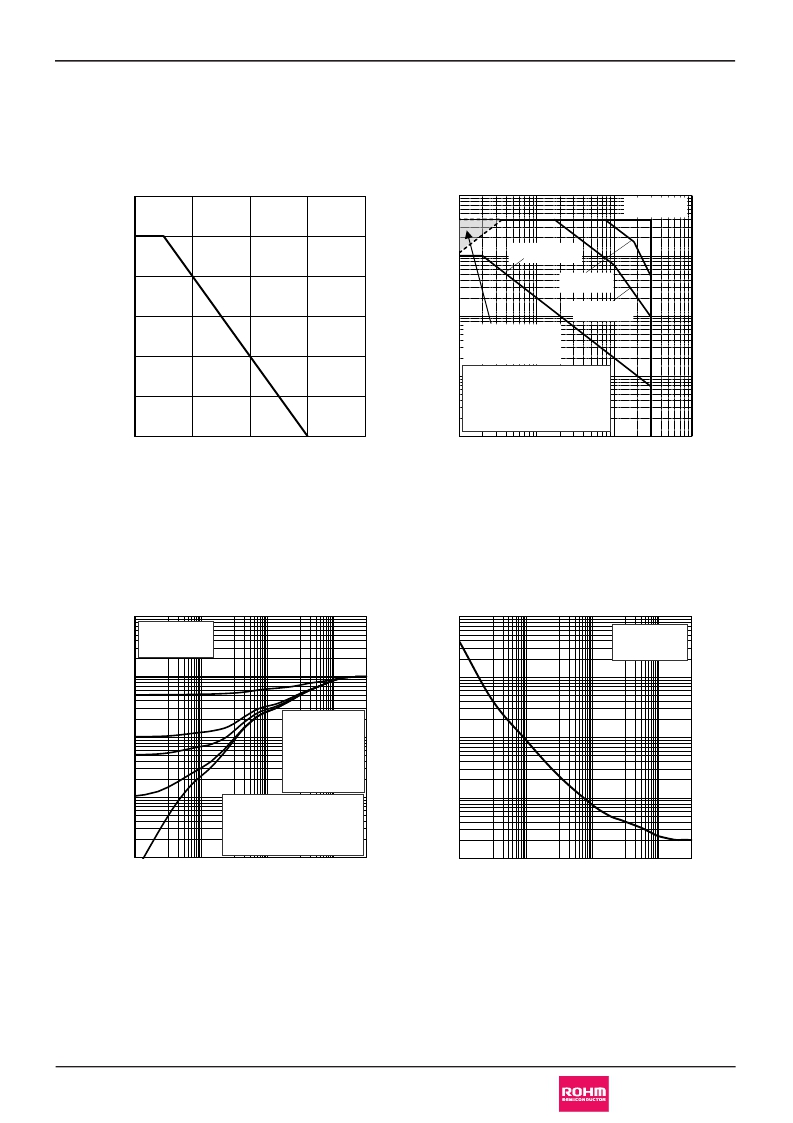
l Electrical characteristic curves
Fig.1 Power Dissipation Derating Curve
Data Sheet
Fig.2 Maximum Safe Operating Area
120
100
100
P W = 100μs
80
10
DC Operation
P W = 1ms
60
40
20
1
0.1
P W = 10ms
Operation in this area
is limited by R DS (on)
( V GS = 10V )
T a =25oC
Single Pulse
Mounted on a ceramic board.
(30mm × 30mm × 0.8mm)
0
0
50
100
150
200
0.01
0.1
1
10
100
Junction Temperature : Tj [ ° C]
Fig.3 Normalized Transient Thermal
Resistance vs. Pulse Width
10
T a =25oC
Single Pulse
1
Drain - Source Voltage : -V DS [V]
Fig.4 Single Pulse Maxmum Power dissipation
10000
T a =25oC
Single Pulse
1000
0.1
0.01
0.001
0.0001
0.01
top D=1
D=0.5
D=0.1
D=0.05
D=0.01
bottom Signle
Rth(ch-a)=62.5oC/W
Rth(ch-a)(t)=r(t) × Rth(ch-a)
Mounted on ceramic board
(30mm × 30mm × 0.8mm)
1 100
100
10
1
0.0001
0.01
1
100
Pulse Width : P W [s]
Pulse Width : P W [s]
www.rohm.com
? 2012 ROHM Co., Ltd. All rights reserved.
4/11
2012.06 - Rev.C
发布紧急采购,3分钟左右您将得到回复。
相关PDF资料
RRH140P03TB1
MOSFET P-CH 30V 14A SOP8
RRL025P03TR
MOSFET P-CH 30V 2.5A TUMT6
RRQ030P03TR
MOSFET P-CH 30V 3A TUMT6
RRQ045P03TR
MOSFET P-CH 30V 4.5A TSMT6
RRR015P03TL
MOSFET P-CH 30V 1.5A TSMT3
RRR030P03TL
MOSFET P-CH 30V 3A TSMT3
RRR040P03TL
MOSFET P-CH 30V 4A TSMT3
RSD050N06TL
MOSFET N-CH 60V 5A SOT428
相关代理商/技术参数
RRH120-070-150-K5B
制造商:Richco 功能描述:Ferrite bead core 12mm K5B
RRH140P03
制造商:ROHM 制造商全称:Rohm 功能描述:4V Drive Pch MOSFET
RRH140P03_12
制造商:ROHM 制造商全称:Rohm 功能描述:Pch -30V -14A Power MOSFET
RRH140P03TB
制造商:ROHM Semiconductor 功能描述:
RRH140P03TB1
功能描述:MOSFET Pch -30V -14A MOSFET RoHS:否 制造商:STMicroelectronics 晶体管极性:N-Channel 汲极/源极击穿电压:650 V 闸/源击穿电压:25 V 漏极连续电流:130 A 电阻汲极/源极 RDS(导通):0.014 Ohms 配置:Single 最大工作温度: 安装风格:Through Hole 封装 / 箱体:Max247 封装:Tube
RRH157-070-286-K5B
制造商:Richco 功能描述:Ferrite bead core 15.7mm K5B
RRH158-079-160-K5B
制造商:Richco 功能描述:Ferrite bead core 15.8mm K5B
RRH160-090-280-K5B
制造商:Richco 功能描述:Ferrite bead core 16mm K5B
